
ArchaeoPhases
500 Words | Approximately 3 Minutes Read | Last Modified on November 1, 2018
In Spring 2016 I took up the opportunity to participate in a two-day conference on Bayesian statistics in archaeology in Nantes, France. Hosted jointly by Philippe Lanos of the Université de Rennes and Anne Philippe at the Université de Nantes, it was a chance to meet and talk with scholars actively working with Bayesian statistics, mostly as archaeologists apply those statistics to dating problems. I was able to catch up with two long-time friends, Caitlin Buck and Bo Meson from Sheffield, and had especially interesting conversations with Andrew Millard from Durham and Frances Healy from Cardiff, whose archaeological work I’d read with interest and admiration.
Philippe and Anne had recently released a Bayesian calibration application,
ChronoModel, that implements a slightly different model than the one Caitlin
implemented in BCal and also used by OxCal. Listening to Anne, Philippe, and
Caitlin discuss the pros and cons of their design decisions helped me make sense
of the high-level statistical papers that describe the decisions. The main
difference is how the models estimate phase boundaries. BCal and OxCal model the
phase boundaries based on an assumption about the distribution of samples within
the phases; ChronoModel doesn’t make the assumption needed to model the phase
boundaries, so it uses the earliest and latest estimates from samples assigned
to the phase. The upshot: don’t expect ChronoModel to agree with BCal or OxCal
on phase boundary estimates—if they do agree, then it is simply a matter of
chance. Also, if the chronological model you are building uses phase boundaries
as target events, then do take the time to understand exactly what the phase
boundary estimates are giving you.
I learned about ArchaeoPhases during the conference dinner when the discussion
turned to the open source statistical software application, R. Anne was excited
by Shiny, an R package for designing interactive web applications. I agreed with
her that applications created with it might help archaeologists gain access to
the statistical power of R.
More exciting for me was learning that ArchaeoPhases included an improved
version of the Tempo plot, which I had recently developed as an open source
software project. My version of the Tempo plot assumed a normal approximation
throughout, which made it easy to implement in R and didn’t tax my limited grasp
of mathematics. Anne used her considerable mathematics skills to put the Tempo
plot on a firmer Bayesian footing. The ArchaeoPhases user can now choose between
the normal approximation and the full Bayesian treatment when calling the
TempoPlot function. Check it out!
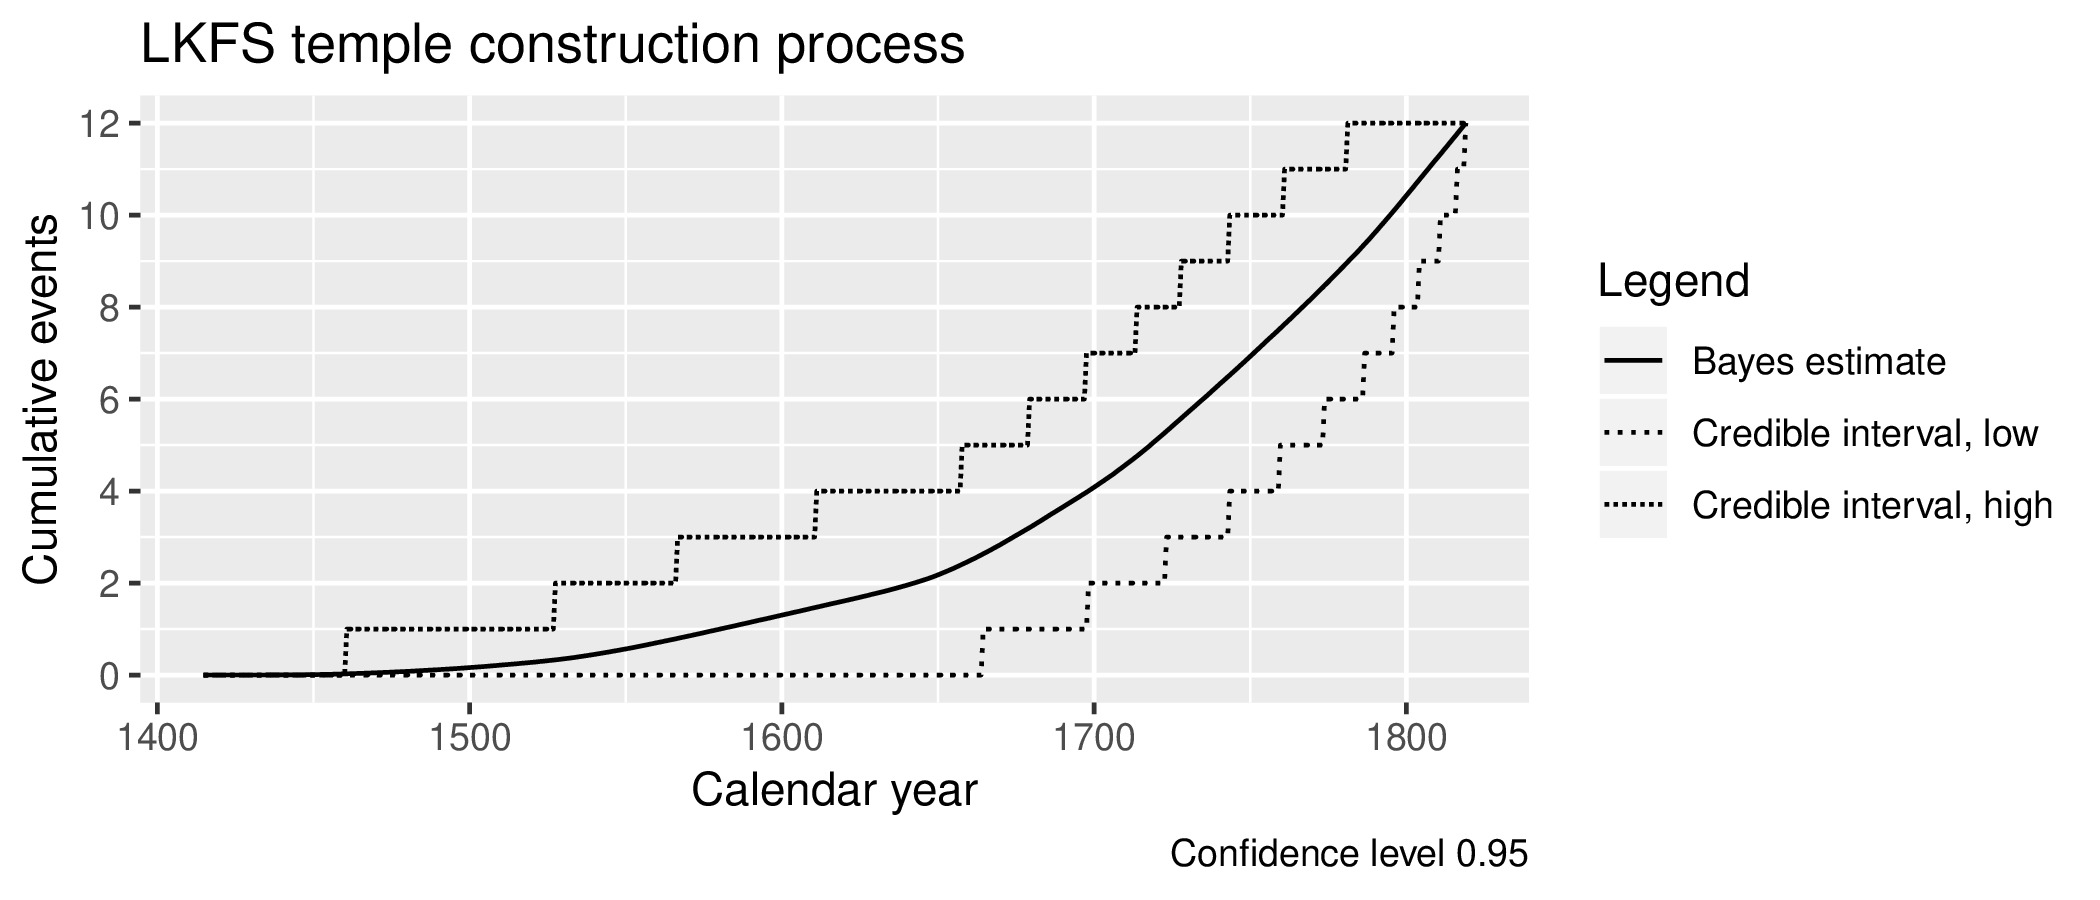
Figure 1: Example of a Tempo plot with the full Bayesian treatment.